

High Need
- 0.67 z-score effect size*
- 81 schools
- 9,432 students
- 16 states
AL, AZ, CA, CO, FL, IA, IL, LA, MA, MO, MS, NM, NV, NY, UT, WI
Study

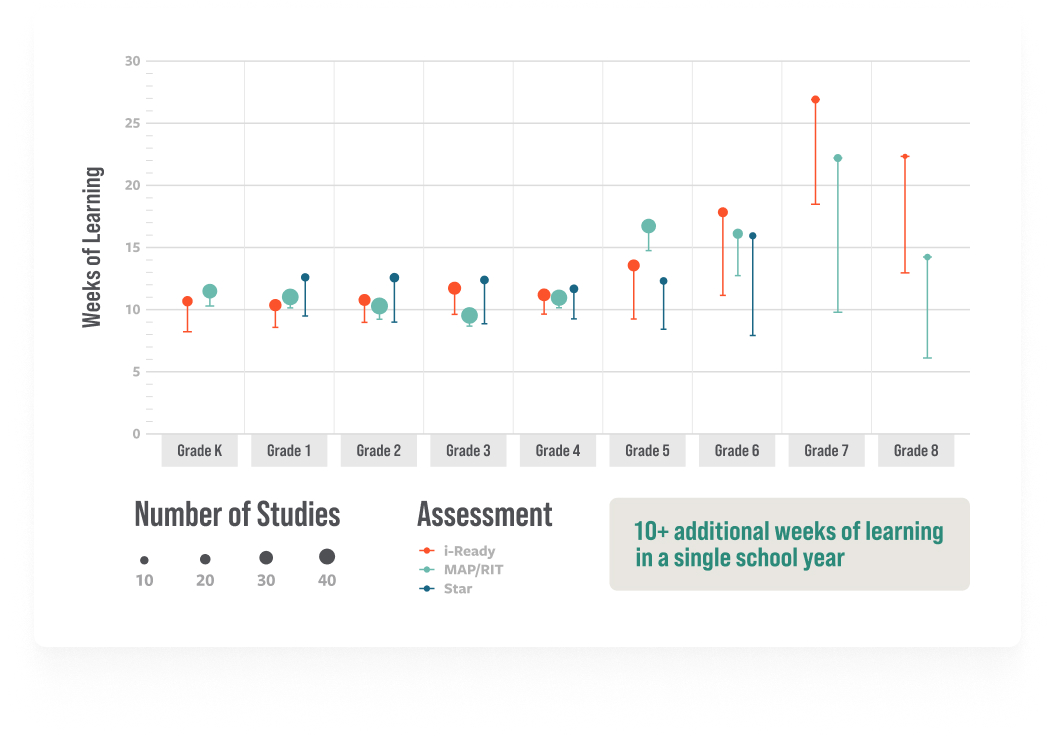
ST Math has demonstrated repeatable learning gains from Kindergarten through middle school across multiple nationally recognized assessments, including i-Ready, MAP®/RIT, and Star.
These findings show consistent impact across every grade level—not just in a single study, or at a single district, but on all students, not a select group.
More than half of students believe they aren’t “math people.” This perception highlights the critical need for meaningful engagement and outcomes for all learners.
At MIND Education, we create environments rooted in brain-based learning principles that foster deep understanding, critical thinking, and problem-solving—aligning with how every human brain is naturally designed to learn.
Our patented, evidence-based approach shifts traditional math learning from rote memorization to meaningful, conceptual understanding. ST Math reaches students of all levels and abilities, engaging them in ways that build confidence and mastery. The result? Proven gains in math comprehension and state assessment scores.
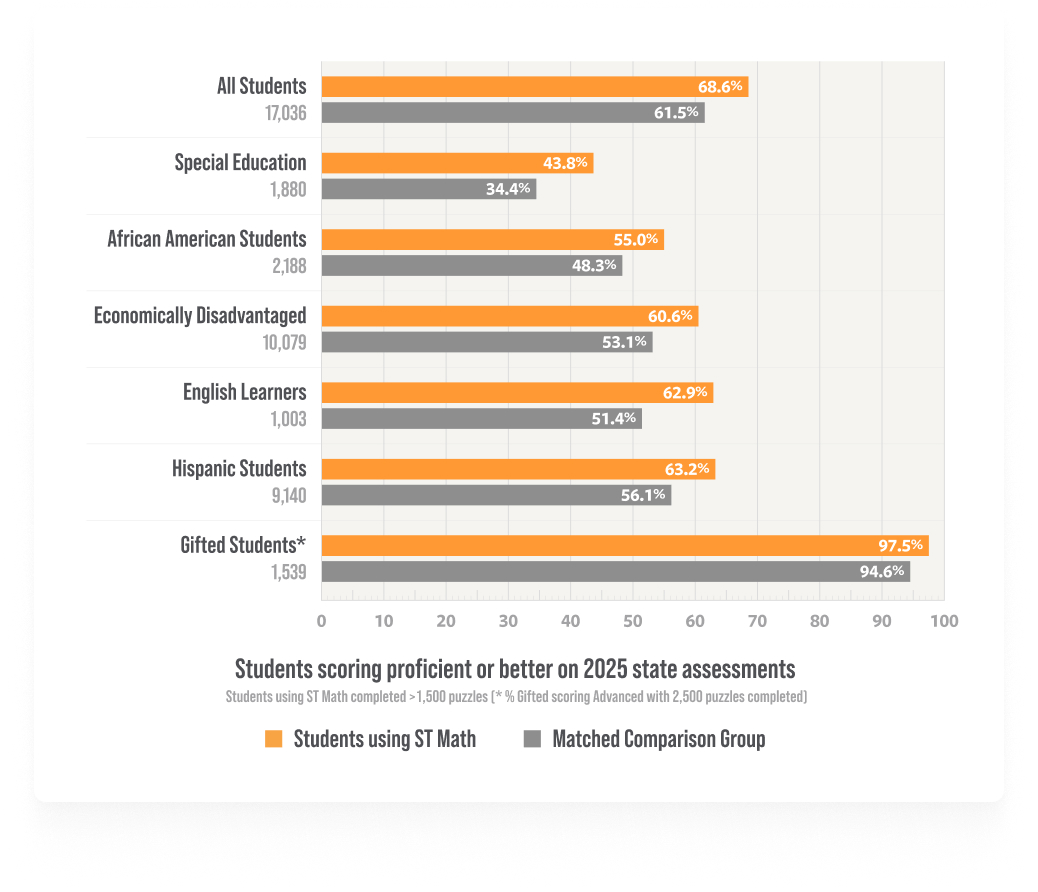
Equity isn’t just a goal; it’s a measurable reality.
Across all subgroups, students using ST Math achieve comparable gains in math learning. This is equitable impact in action. Above: results of a quasi-experimental study, showing effect sizes consistently between 0.35 and 0.50.

At MIND Education, research is more than a checkbox—it’s a commitment. Our rigorous, ongoing studies span students, schools, districts, and states, ensuring that every claim we make is backed by evidence. Each new school becomes part of our continuous improvement process, holding us accountable to deliver robust, repeatable results year after year.
Our programs are grounded in neuroscience, validated through rigorous studies, and proven—year after year—to drive measurable, lasting outcomes for students and educators alike.
We don’t wait for validation—we build for it. Our impact is measured consistently, across diverse settings, and evaluated over time. Explore how we prove what others only promise.

Our national research includes schools from every corner of the country, representing the full spectrum of ST Math implementation. This allows us to study districts with diverse needs and contexts, consistently demonstrating the same pattern of success: ST Math boosts math scores at all performance levels.
Whether your district is urban, rural, high-performing, or under-resourced, our research shows that ST Math works. Don’t see a study matching your district type? Reach out, and we’ll provide data tailored to your unique context.
AL, AZ, CA, CO, FL, IA, IL, LA, MA, MO, MS, NM, NV, NY, UT, WI
Study
AZ, CA, IA, IL, MA, MT, NH, NJ, NV, NY, OH, UT, VA
Study
AR, AZ, CA, FL, IA, IL, MA, MT, NV, NY, PA, TX, UT, VA
Study
AR, CA, CT, FL, IA, MA, MO, MT, NH, TX, UT, VA, WI
Study
AZ, CA, CO, GA, IA, MA, MI, MN, MO, NC, NJ, NV, NY, OH, PA, TX, UT, VA
Study
AZ, CA, CO, DC, FL, GA, IL, LA, MA, MD, NM, NV, NY, TX, UT, WI
Study
AZ, CA, IA, IN, MI, MN, NJ, NV, NY, PA, TX, UT
Study
CA, FL, LA, MA, MO, NY, UT
Study
AL, AZ, CA, CO, FL, IA, IL, LA, MA, MO, MS, NM, NV, NY, UT, WI
Study
AR, AZ, CA, CO, IL, MA, NJ, NM, NV, NY, TX, UT, WI
Study
AL, CA, CT, FL, GA, IA, IL, LA, MA, MO, MS, NC, NJ, NV, NY, TX, VA
Study*Statistically significant. †Analyzed by grade-level datasets.
I’m encouraged to see that ST Math continues to show significant effects on math achievement. But I’m even more impressed with the breadth of ST Math evaluations towards evaluating every school, every year, which provides a model for other educational technology companies to follow.
Tonika Cheek Clayton, Managing Partner, New Schools Venture Funds